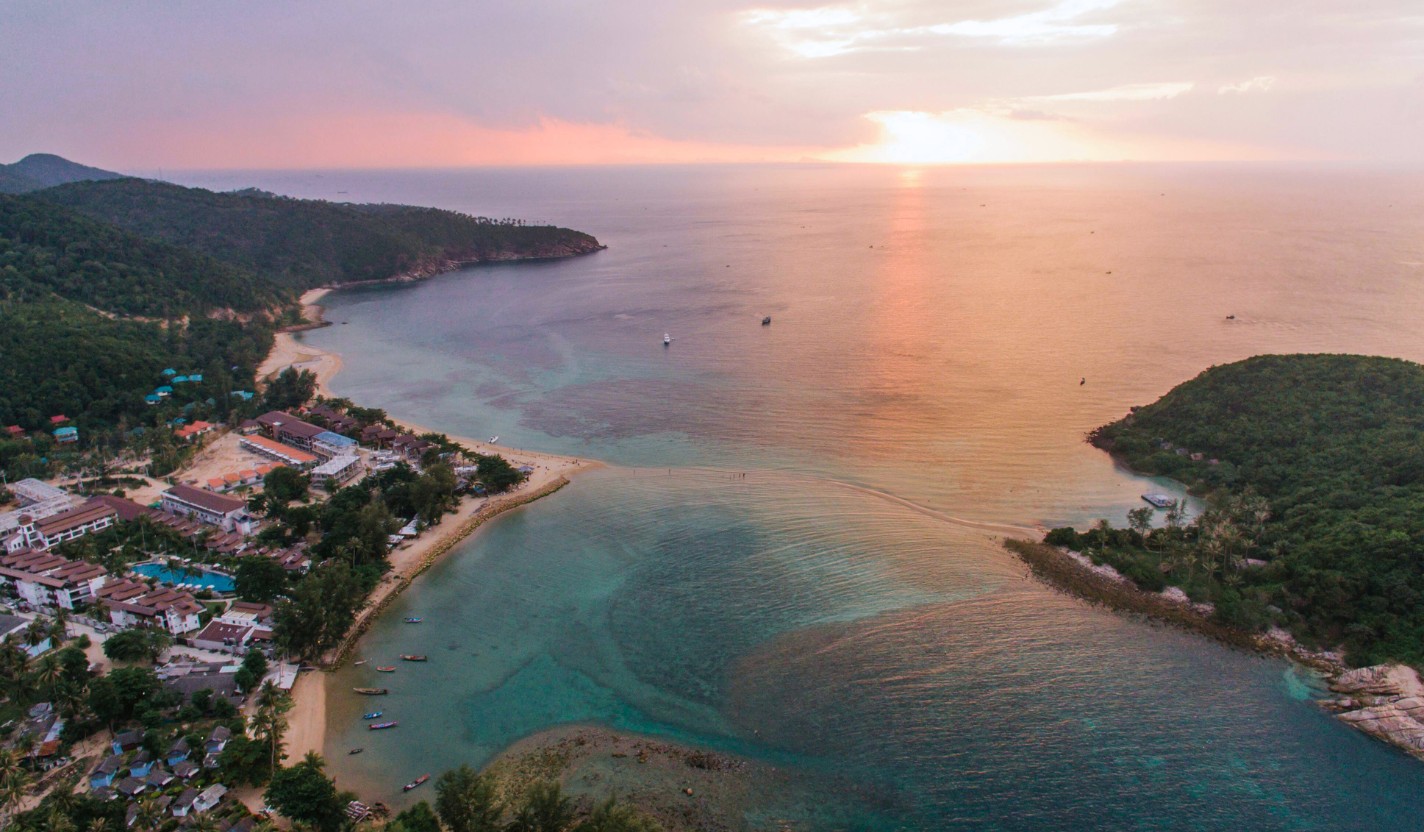
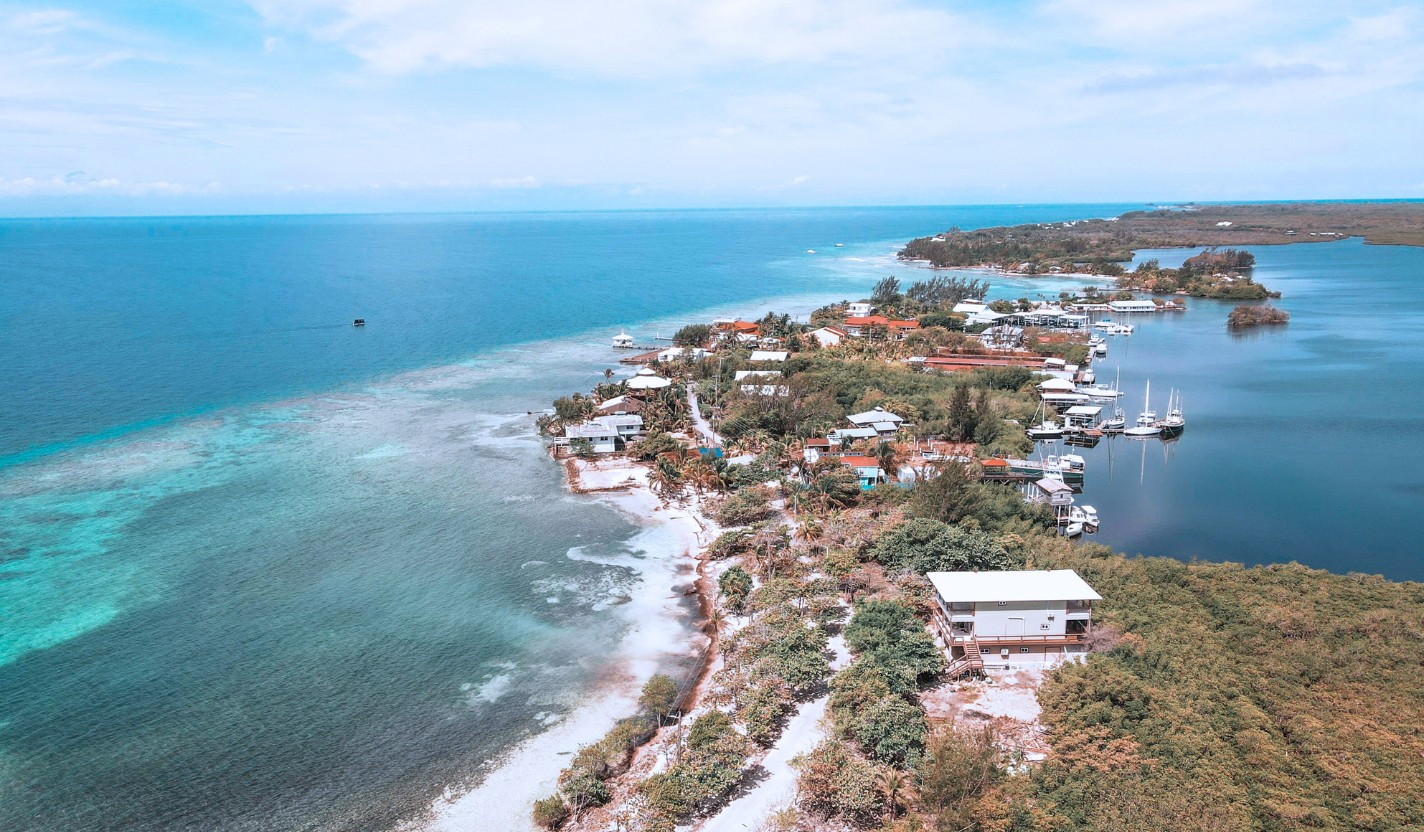
Malhada Beach

About Spot
Icon

Sports

Icon

Best season

  • December
  • -
  • June
Icon

Level of riding

  • all-level
Icon

Board styles

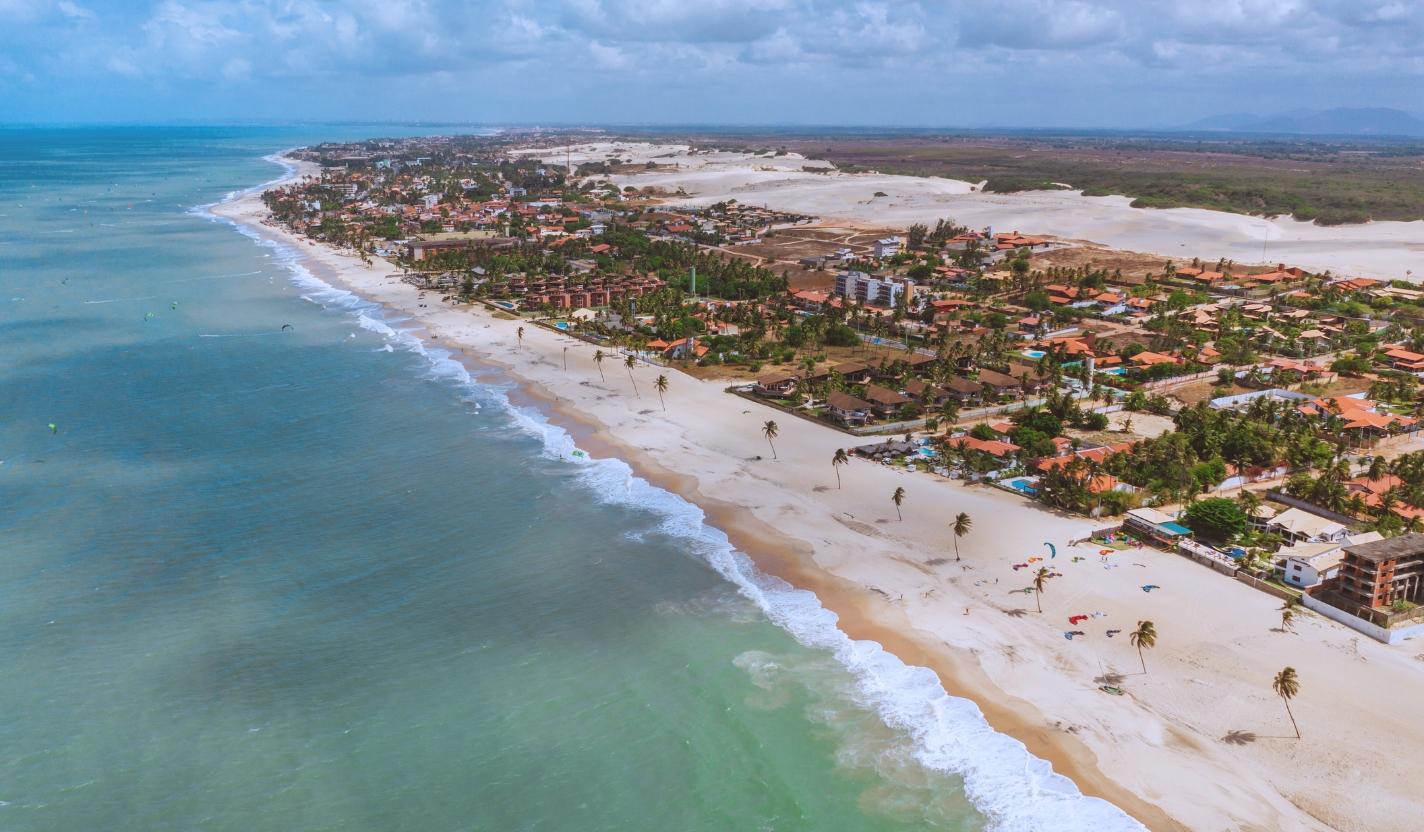
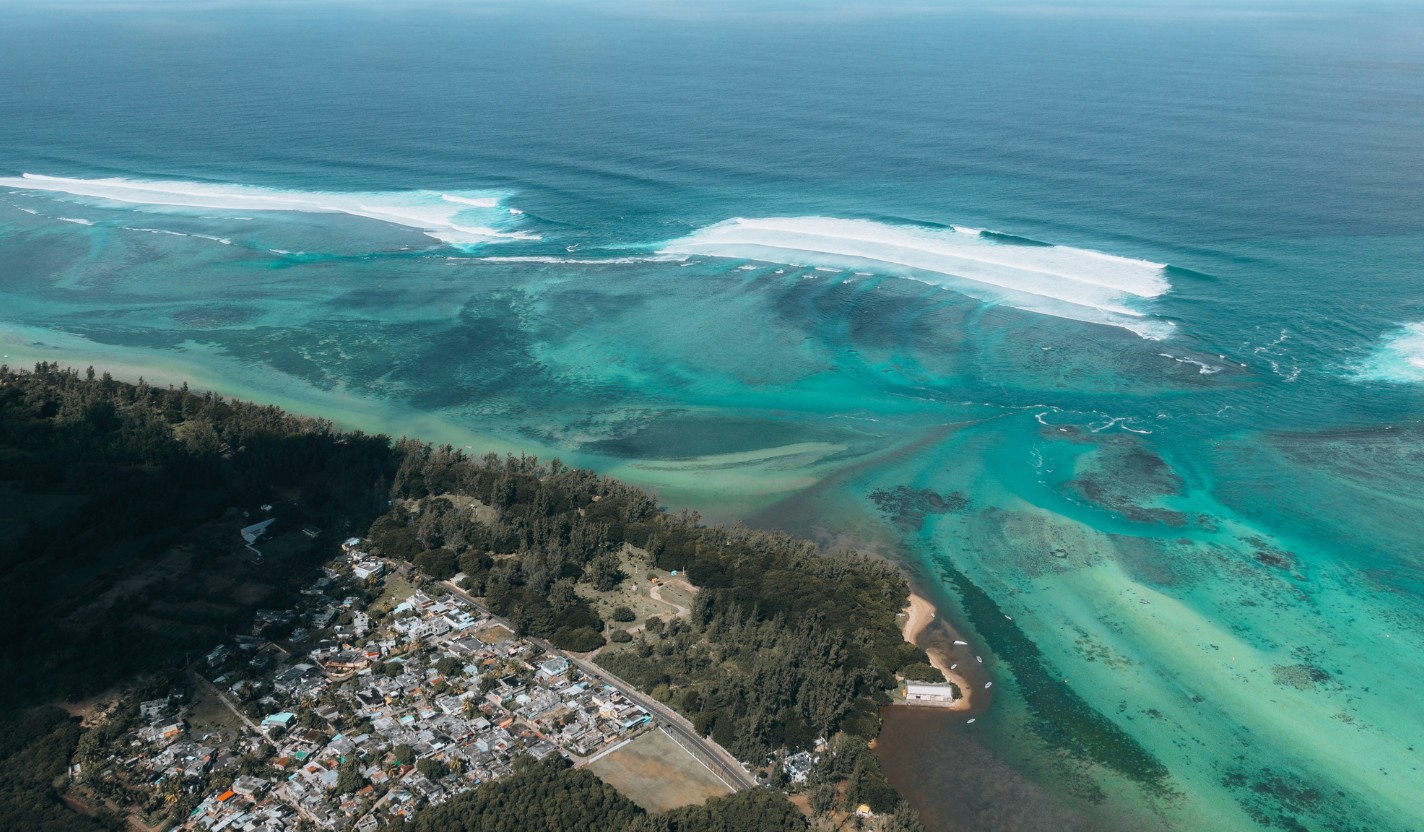
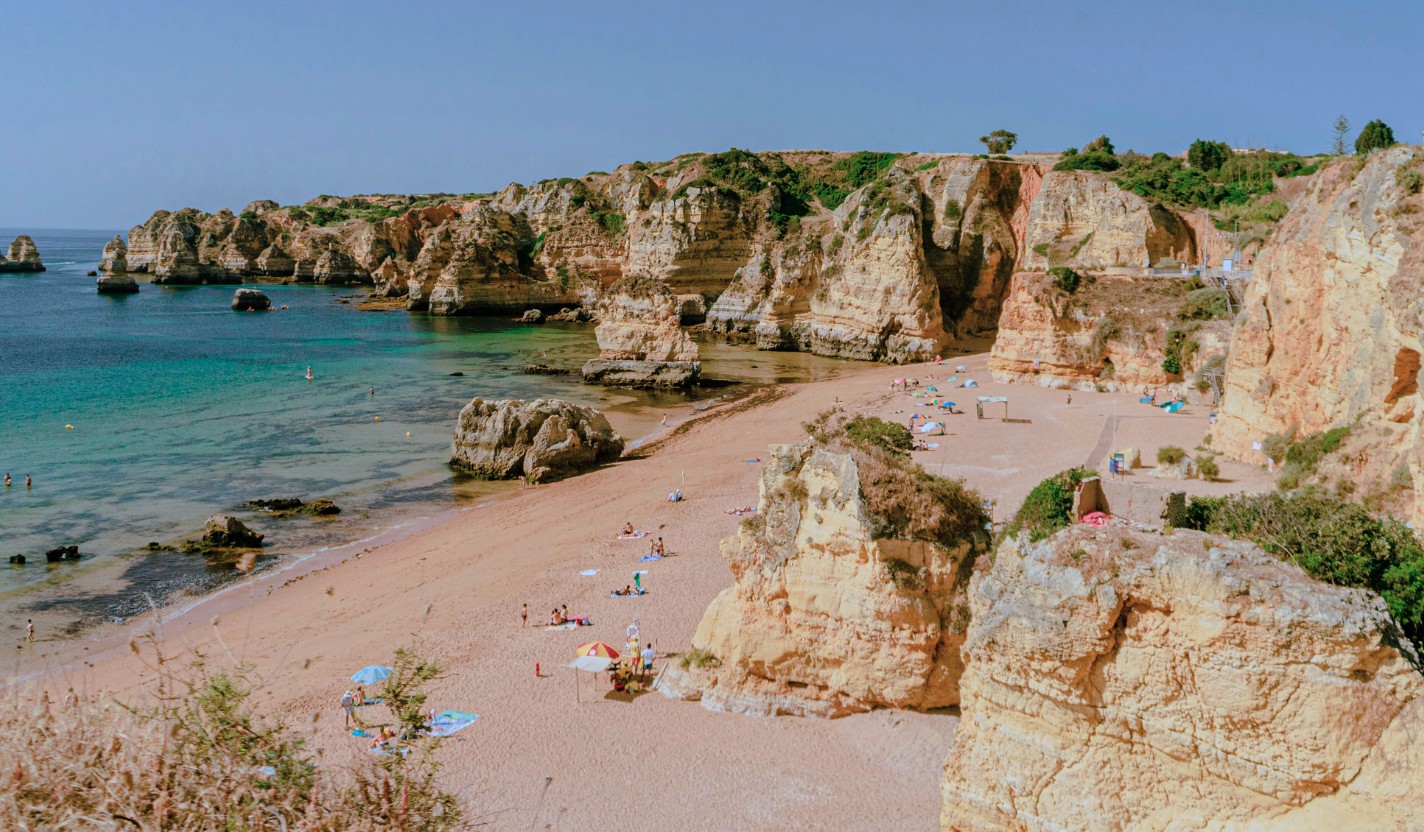
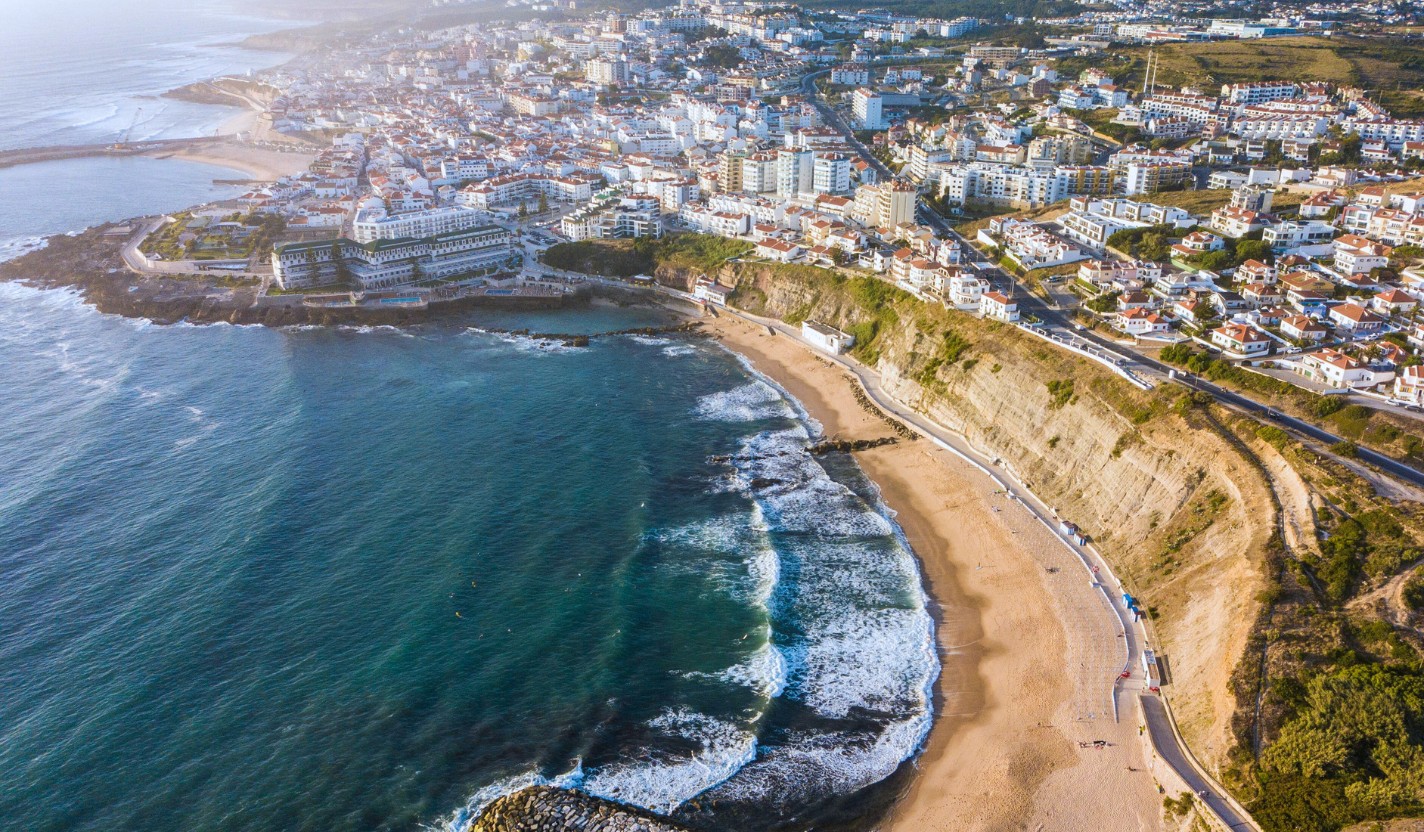
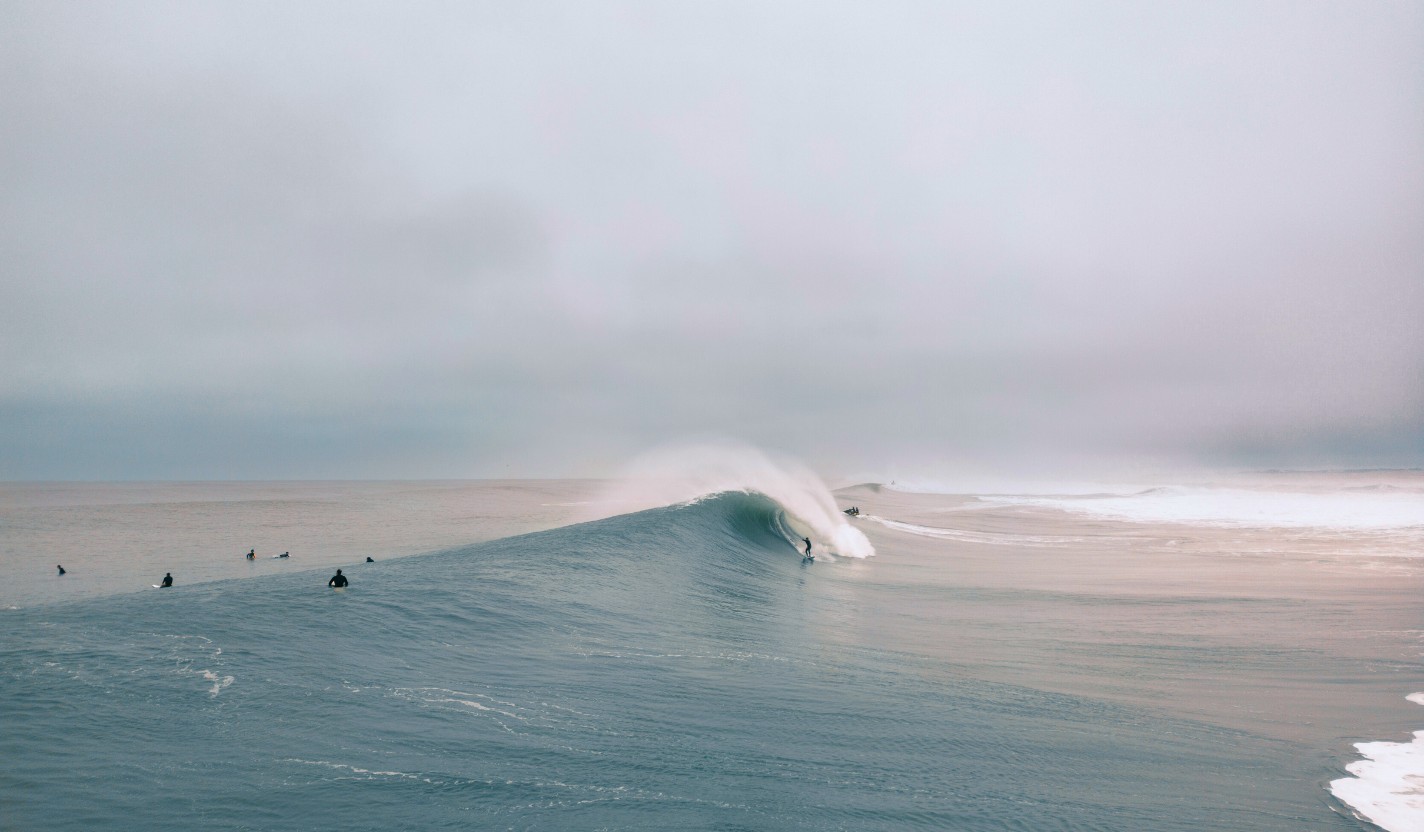
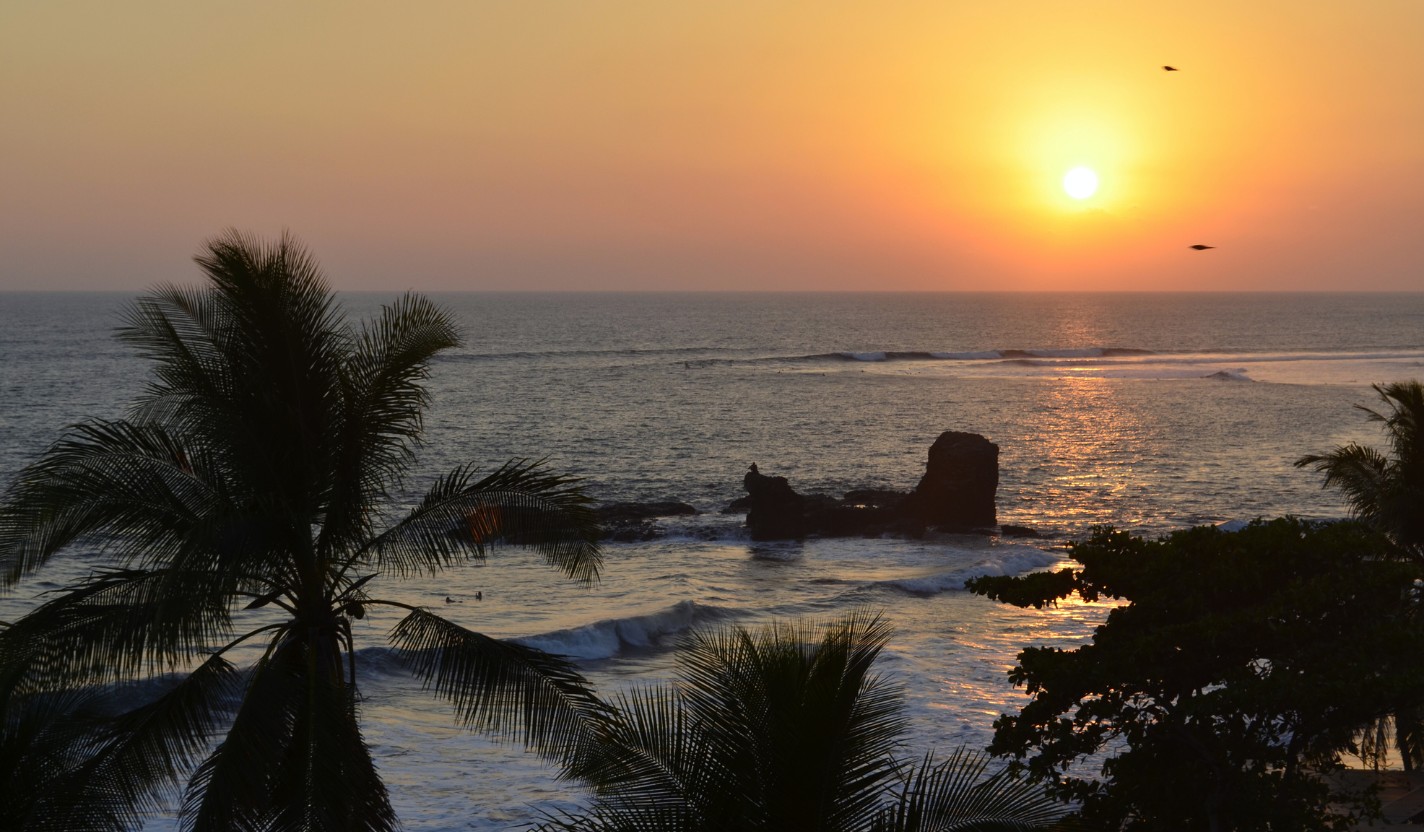
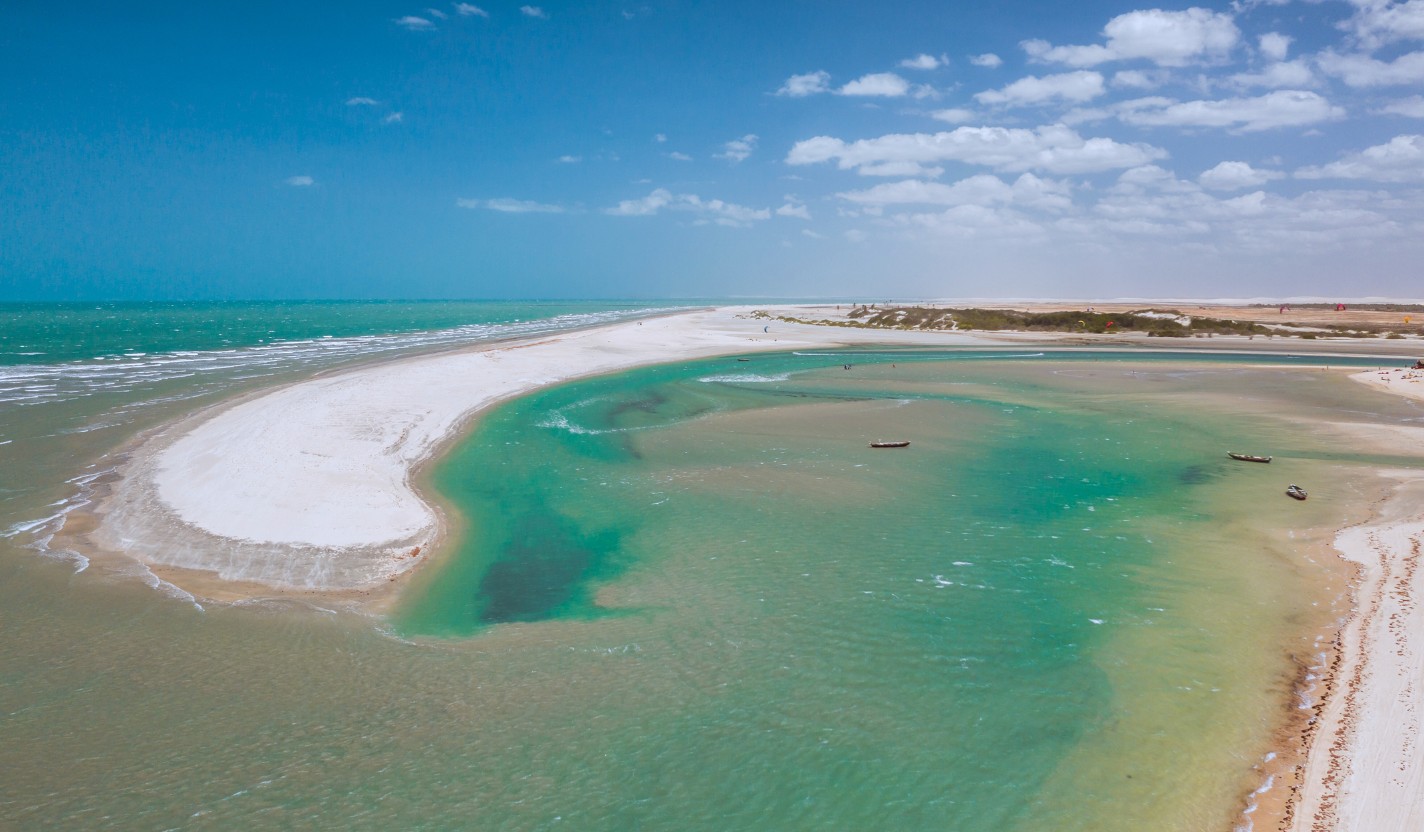
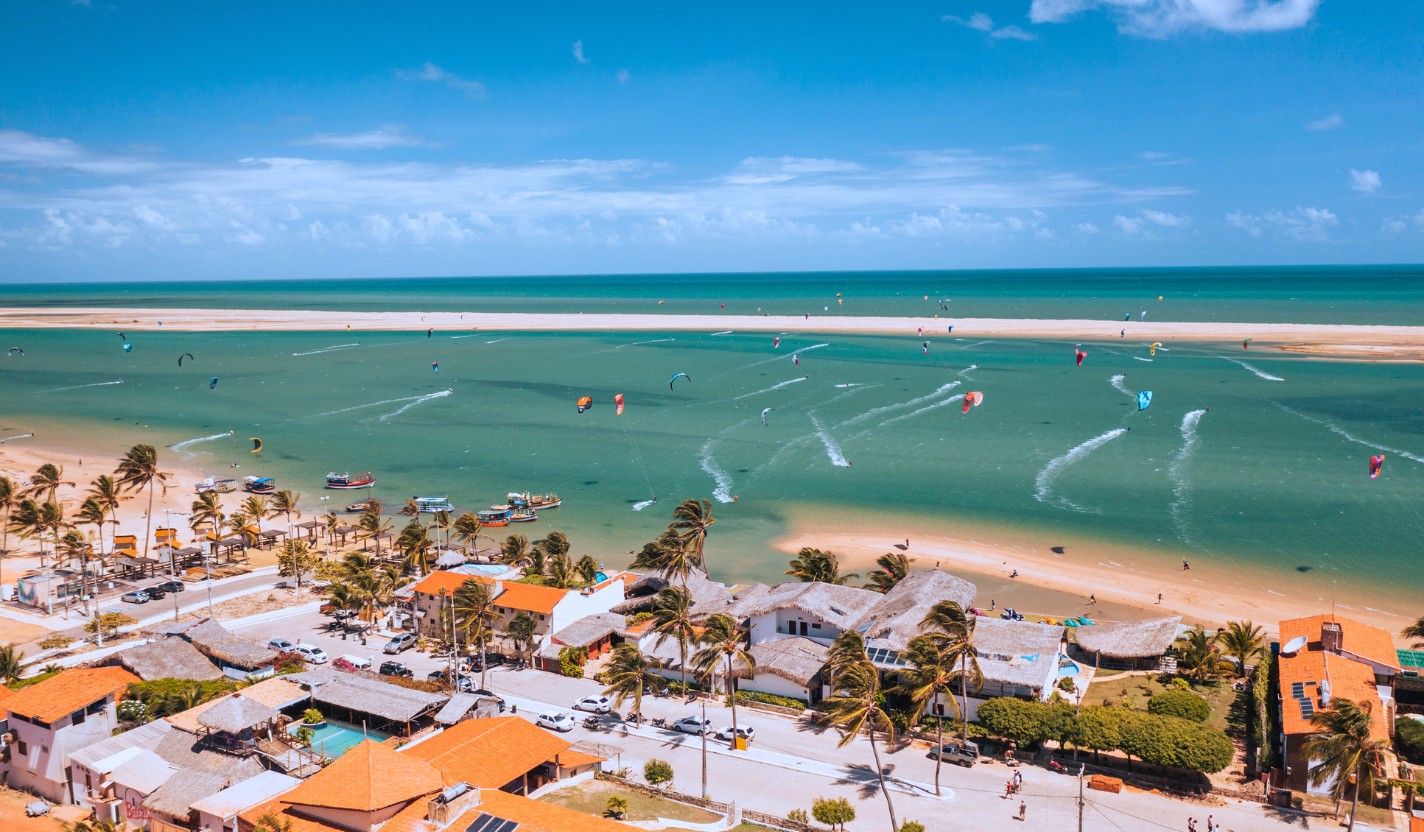
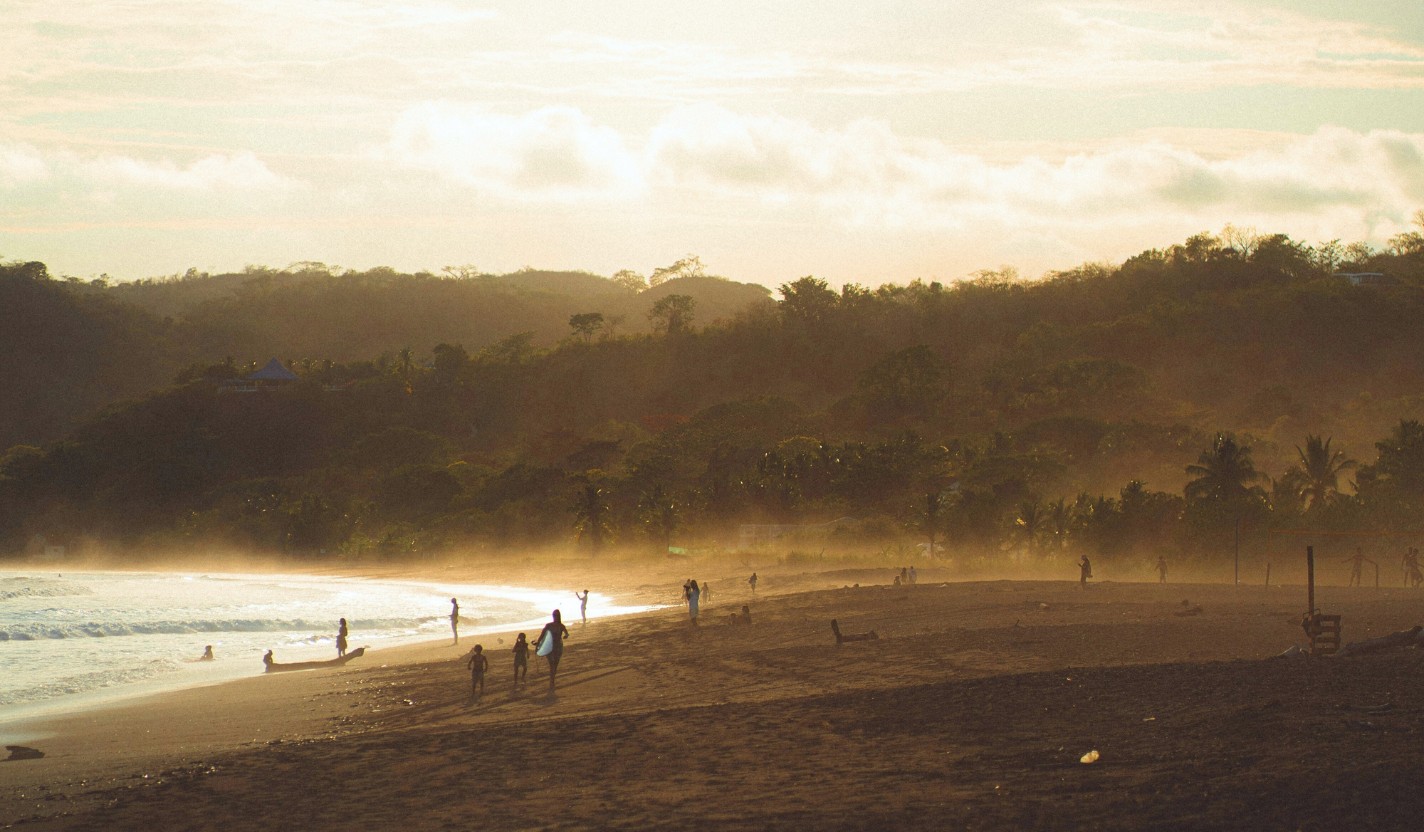
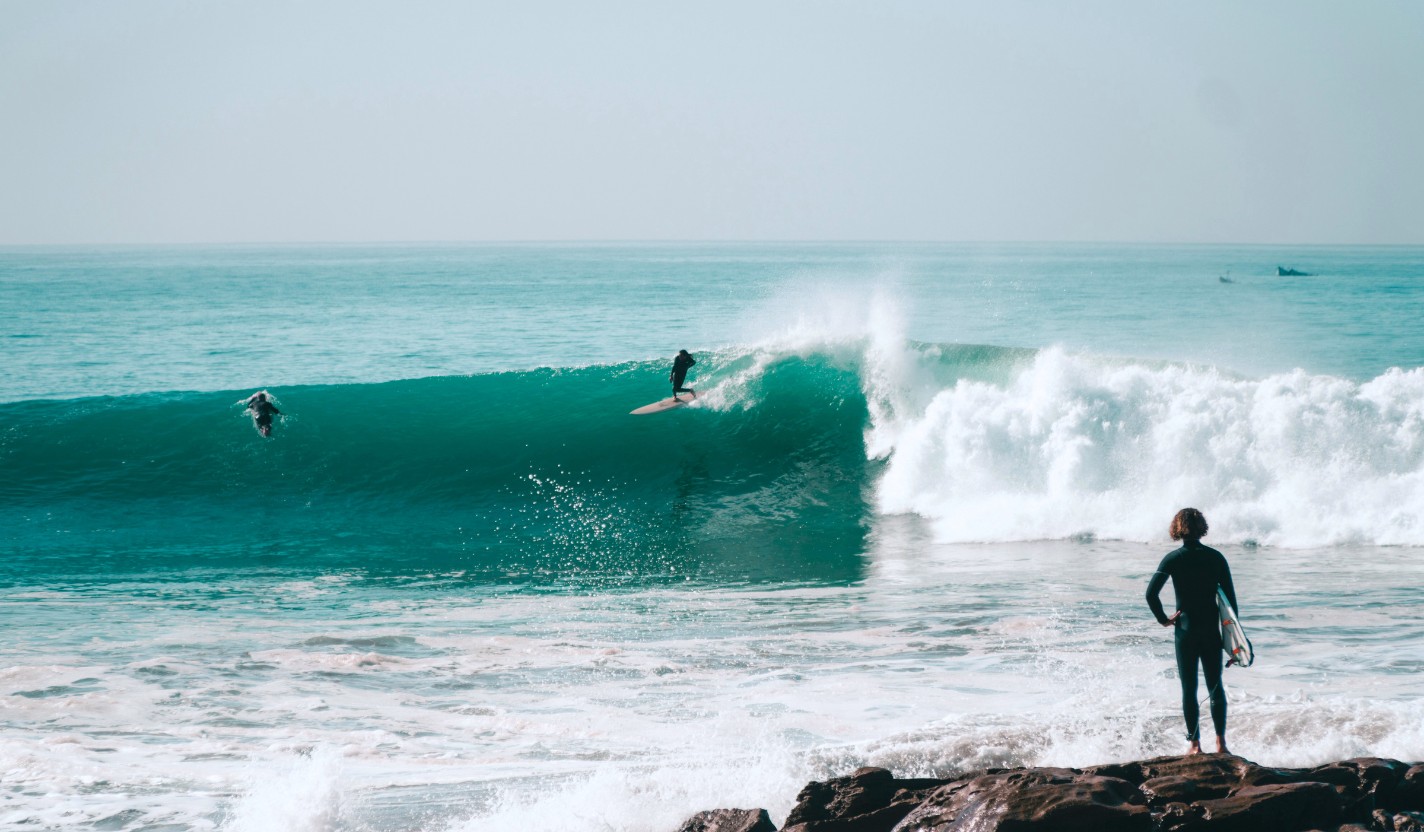
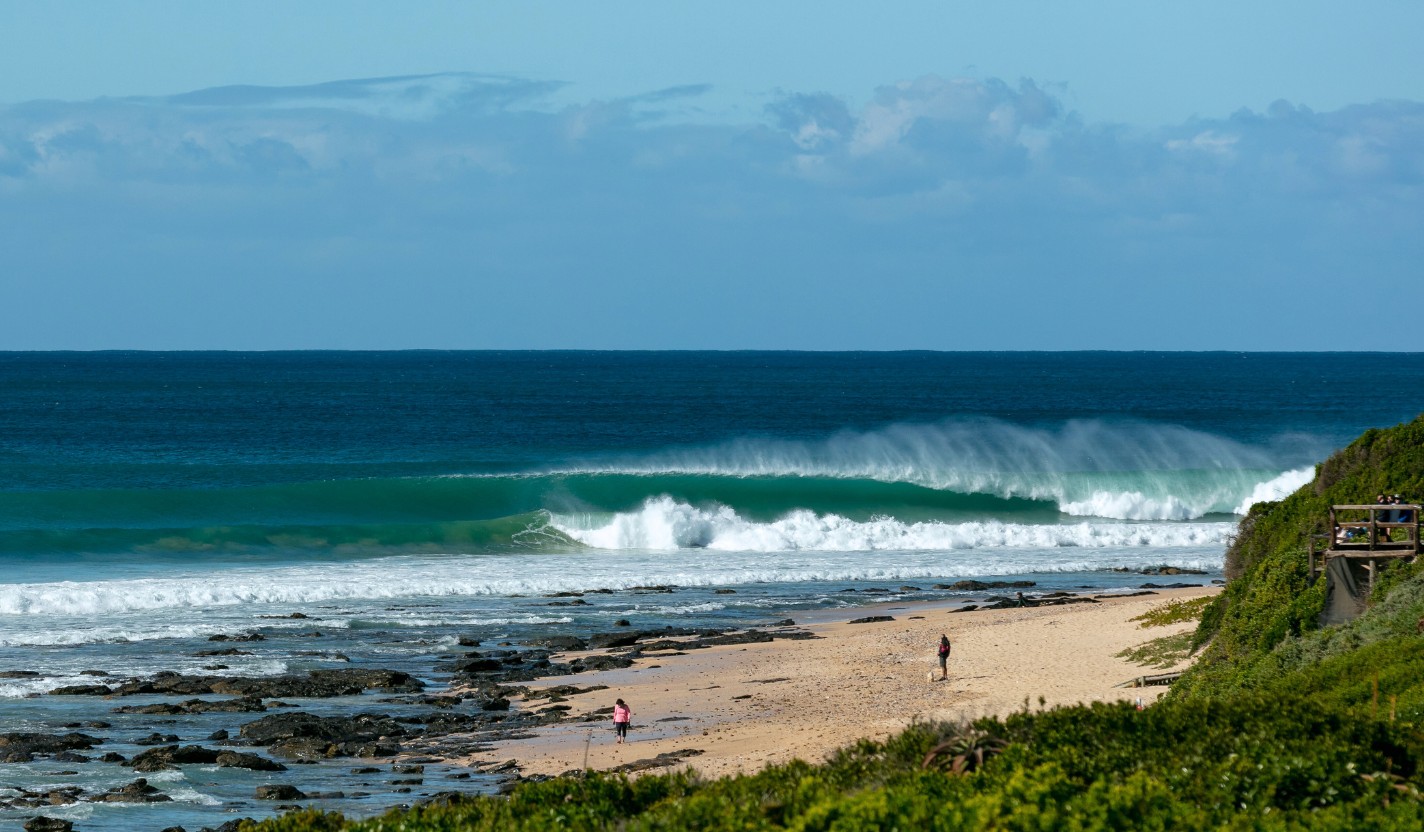
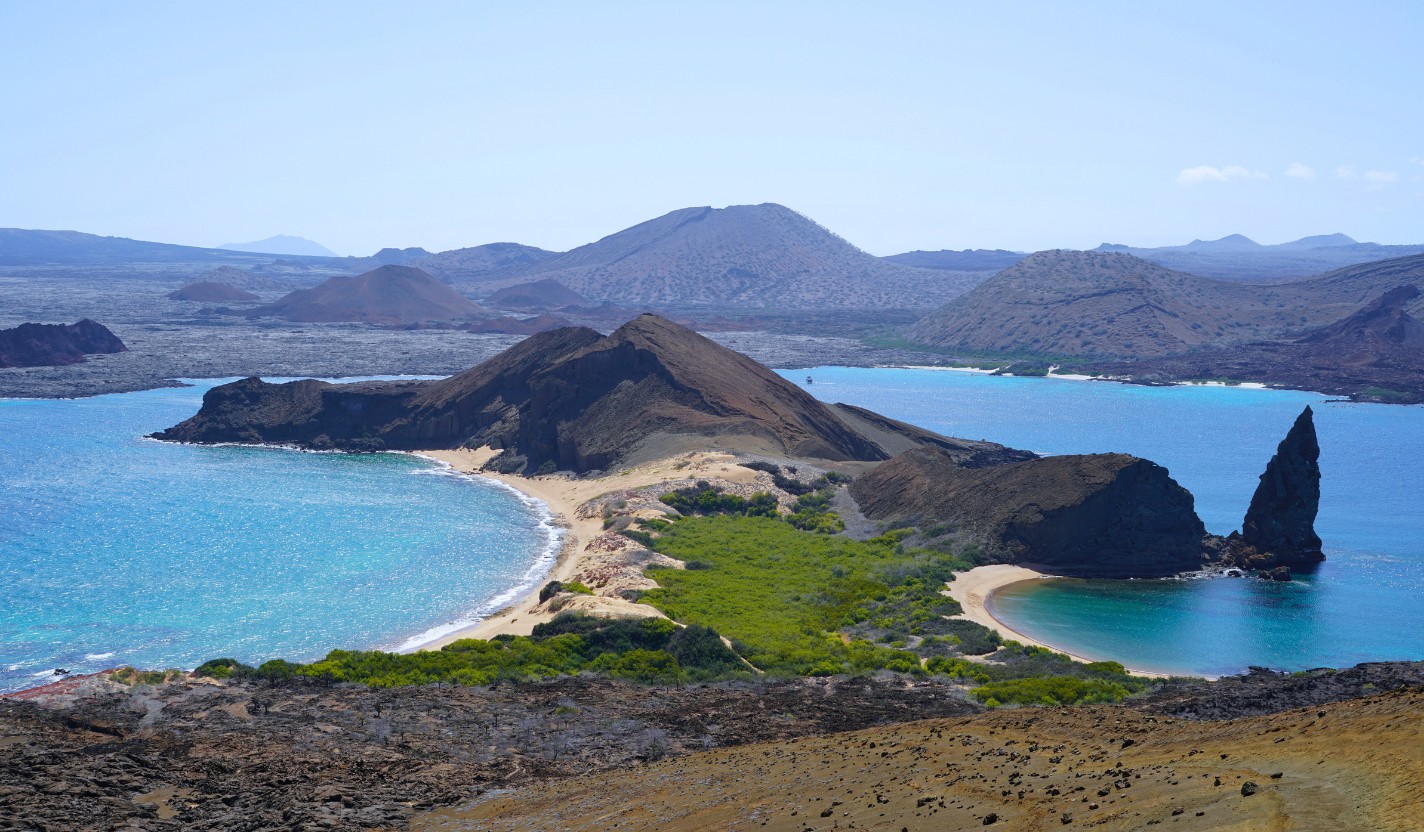
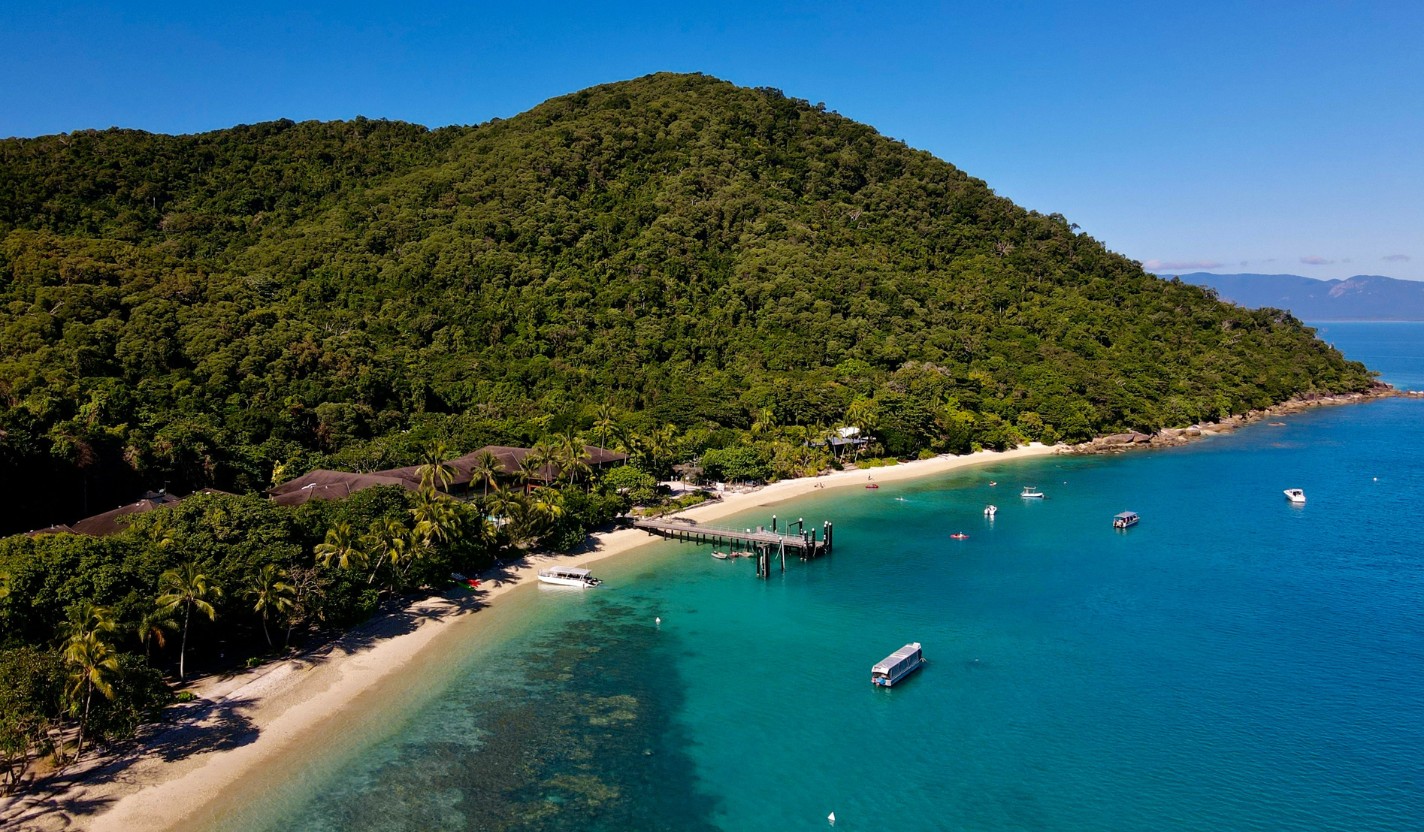
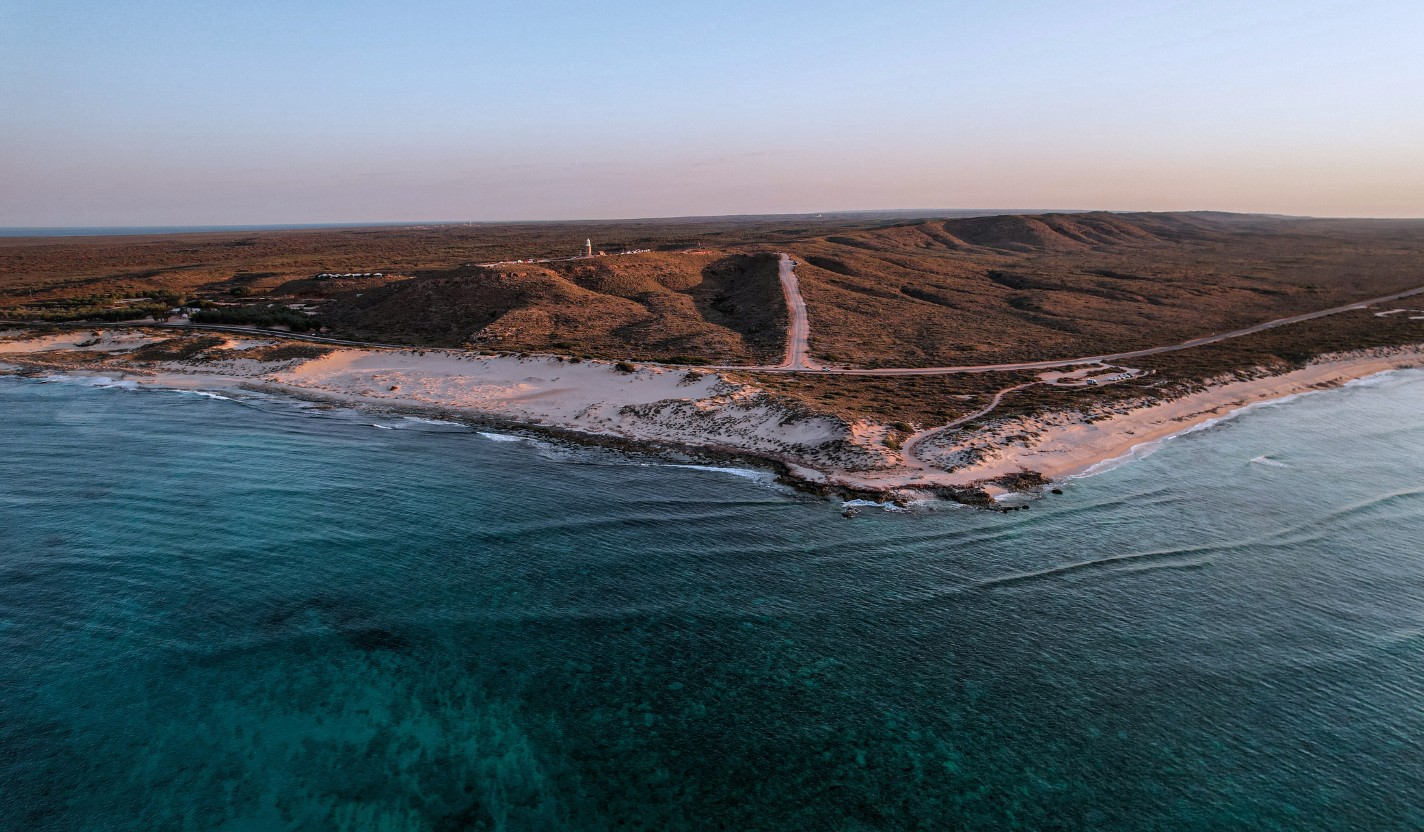
Malhada Beach delivers reliable right-handers over a sandy bottom, making it perfect for intermediate surfers like you. The waves really peak during the rainy season, offering solid and enjoyable rides. The lineup is super laid-back, so it’s a great place to connect with locals and fellow travelers while you chase those rights. Get ready for some fun in the water!

Information

Average water temperature

Bodywear

Traffic

Best tide for riding

Wind direction

Optimal size

Wave break

Optimal swell direction

Paddle entry rating (1-10)

Beach facilities

Around the spot

Parking access

Access to the spot

Stats

Wave Size

Popular Destinations

WHAT WE DO

At outriderx, we deliver unforgettable water adventures for everyone. Whether you’re new to the waves or a seasoned pro, we connect you with the thrill of wind and water. Join us for personal growth and become part of a vibrant adventure-loving community.

// var windData = []; // // Morris.Bar({ // element: 'bar-chart', // data: windData, // xkey: 'y', // ykeys: ['a', 'b', 'c', 'd'], // labels: ['Strong Wind A', 'Total Outcome B', 'C', 'D'], // fillOpacity: 0.6, // hideHover: 'auto', // resize: true, // barSizeRatio: 0.6, // barColors: ['#adcefd', '#8bbdf6', '#66abf9', '#2c9aff'], // smooth: false, // pointFillColors: ['#ffffff'], // pointStrokeColors: ['black'], // hoverCallback: function (index, options, content, row) { // var windValue = row.a; // Adjust if necessary // return `
// ${windValue} days
// of strong wind //
`; // } // }); // // // // === WAVE GRAPH (using Chart.js) === // // (function() { // const waveSizeElement = document.getElementById('waveSizeChart'); // if (waveSizeElement) { // const waveSizeCtx = waveSizeElement.getContext('2d'); // // Create a vertical linear gradient // const waveSizeGradient = waveSizeCtx.createLinearGradient(0, 0, 0, 400); // waveSizeGradient.addColorStop(0, '#407bff'); // waveSizeGradient.addColorStop(1, '#92d5f9'); // // Ensure $wave1 is an indexed array // const waveData = //; // new Chart(waveSizeCtx, { // type: 'bar', // data: { // labels: ['Jan','Feb','Mar','Apr','May','Jun','Jul','Aug','Sep','Oct','Nov','Dec'], // datasets: [{ // label: 'Wave Size', // data: waveData, // backgroundColor: waveSizeGradient, // hoverBackgroundColor: waveSizeGradient, // borderRadius: { topLeft: 6, topRight: 6 }, // // borderRadius: 10, // barPercentage: 0.5, // categoryPercentage: 0.7, // }] // }, // options: { // plugins: { // legend: { display: false }, // tooltip: { // enabled: false, // Custom tooltip below // external: function(context) { // let tooltipEl = document.getElementById('custom-tooltip'); // if (!tooltipEl) { // tooltipEl = document.createElement('div'); // tooltipEl.id = 'custom-tooltip'; // tooltipEl.style.background = '#000'; // tooltipEl.style.borderRadius = '20px'; // tooltipEl.style.color = 'white'; // tooltipEl.style.opacity = 1; // tooltipEl.style.padding = '5px 5px'; // tooltipEl.style.position = 'absolute'; // tooltipEl.style.transform = 'translate(-50%, -100%)'; // tooltipEl.style.pointerEvents = 'none'; // tooltipEl.style.transition = '0.1s ease'; // document.body.appendChild(tooltipEl); // } // const tooltipModel = context.tooltip; // if (tooltipModel.opacity === 0) { // tooltipEl.style.opacity = 0; // return; // } // if (tooltipModel.body) { // const dataValue = tooltipModel.dataPoints[0].raw; // const percentage = Math.round((dataValue / 100) * 100); // tooltipEl.innerHTML = `
// ${percentage}% chances //
`; // } // const position = context.chart.canvas.getBoundingClientRect(); // const tooltipX = position.left + window.pageXOffset + tooltipModel.caretX; // const tooltipY = position.top + window.pageYOffset + tooltipModel.caretY; // tooltipEl.style.left = tooltipX + 'px'; // tooltipEl.style.top = tooltipY + 'px'; // tooltipEl.style.opacity = 1; // } // } // }, // scales: { // x: { grid: { display: false } }, // y: { grid: { display: false, color: '#F0F0F0' }, ticks: { stepSize: 5 } } // } // } // }); // } else { // console.error('waveSizeChart element not found!'); // } // })(); // // // // === DEPTH GRAPH (using Chart.js) === // // (function() { // const waterTempElement = document.getElementById('waterTempChart'); // if (waterTempElement) { // const waterTempCtx = waterTempElement.getContext('2d'); // // Create a vertical linear gradient for water temperature // const waterTempGradient = waterTempCtx.createLinearGradient(0, 0, 0, 400); // waterTempGradient.addColorStop(0, '#F2AD5B'); // waterTempGradient.addColorStop(1, '#7A9DF4'); // // Ensure $depth1 is an indexed array // const depthData = //; // new Chart(waterTempCtx, { // type: 'bar', // data: { // labels: ['Jan','Feb','Mar','Apr','May','Jun','Jul','Aug','Sep','Oct','Nov','Dec'], // datasets: [{ // label: 'Water Temp', // data: depthData, // backgroundColor: waterTempGradient, // hoverBackgroundColor: waterTempGradient, // borderRadius: { topLeft: 6, topRight: 6 }, // // borderRadius: 30, // barPercentage: 0.6, // categoryPercentage: 0.8, // }] // }, // options: { // plugins: { // legend: { display: false }, // tooltip: { // enabled: false, // external: function(context) { // let tooltipEl = document.getElementById('custom-tooltip'); // if (!tooltipEl) { // tooltipEl = document.createElement('div'); // tooltipEl.id = 'custom-tooltip'; // tooltipEl.style.background = '#000'; // tooltipEl.style.borderRadius = '15px'; // tooltipEl.style.color = 'white'; // tooltipEl.style.opacity = 1; // tooltipEl.style.padding = '5px 5px'; // tooltipEl.style.position = 'absolute'; // tooltipEl.style.transform = 'translate(-50%, -100%)'; // tooltipEl.style.pointerEvents = 'none'; // tooltipEl.style.transition = '0.1s ease'; // document.body.appendChild(tooltipEl); // } // const tooltipModel = context.tooltip; // if (tooltipModel.opacity === 0) { // tooltipEl.style.opacity = 0; // return; // } // if (tooltipModel.body) { // const dataValue = tooltipModel.dataPoints[0].raw; // tooltipEl.innerHTML = `
// ${dataValue}°C //
`; // } // const position = context.chart.canvas.getBoundingClientRect(); // const tooltipX = position.left + window.pageXOffset + tooltipModel.caretX; // const tooltipY = position.top + window.pageYOffset + tooltipModel.caretY; // tooltipEl.style.left = tooltipX + 'px'; // tooltipEl.style.top = tooltipY + 'px'; // tooltipEl.style.opacity = 1; // } // } // }, // scales: { // x: { grid: { display: false } }, // y: { // grid: { display: false, color: '#F0F0F0' }, // ticks: { // stepSize: 5, // callback: function(value) { return value + '°C'; } // } // } // } // } // }); // } else { // console.error('waterTempChart element not found!'); // } // })(); // // }); //

Search

Where will your adventure begin?